
How Do You Measure VR Attraction Performance?
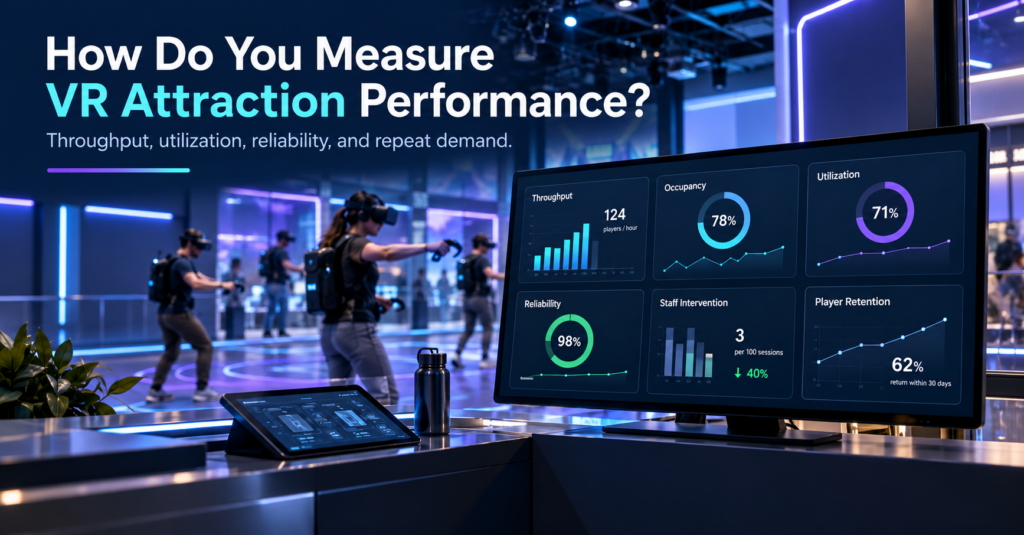
A VR attraction can stay busy and still leave capacity on the table. Two experiences might generate a similar number of bookings over a weekend, yet perform very differently once you look beyond sales. One may start reliably, fill most available player positions, move groups through on schedule, and need little staff attention. The other may lose time through slow launches, partial groups, resets, troubleshooting, or interrupted sessions. For a commercial VR venue, that difference matters. Measuring VR attraction performance means looking at how effectively an attraction turns available time, space, hardware, staff attention, and customer demand into completed guest experiences. Revenue still matters, but it makes much more sense when viewed alongside occupancy, throughput, reliability, operational friction, and repeat demand. A useful way to think about the attraction is as a sequence: Demand → Occupancy → Throughput → Friction → Reliability → Labor → Retention Once those pieces are measured together, the numbers begin to explain why an attraction performs the way it does. Maximum Capacity Is Only the Starting Point Maximum player count tells you how many people an attraction can support under the right conditions. It says much less about how that attraction actually operates during a normal week. Take an eight-player free-roam experience. One venue may regularly fill seven or eight positions, while another mostly runs groups of four or five. Both technically operate an eight-player attraction, but their utilization looks very different. A simple occupancy calculation gives that distinction some structure: Average occupancy = players served ÷ available player slots If an eight-player attraction runs 100 sessions, it offers 800 possible player positions. Serving 520 guests across those sessions gives an average occupancy of 65%. That number helps when comparing attractions with different group sizes, but it still leaves out one important factor: time. An attraction can fill well and still process groups slowly. Related reading: How Many Players Should a VR Attraction Support? Measure Completed Players, Not Just Sessions Launched For many VR venues, practical throughput is more useful than maximum capacity. The calculation is straightforward: Practical throughput = completed players ÷ operating hours The important word here is completed. A free-roam attraction may theoretically support eight players every 30 minutes, which suggests a capacity of 16 players per hour. In a live venue, those 30 minutes sit inside a larger operating cycle. Guests need to arrive, understand the experience, receive their headsets, enter the session, play, exit, and make room for the next group. A five-minute delay before launch and another five minutes during reset turns a 30-minute experience into a 40-minute operating block. Over a full day, the gap between theoretical throughput and actual throughput can become significant. This is particularly visible during birthday parties, school visits, corporate groups, and busy weekend periods because one late session can begin pushing the rest of the schedule behind it. The useful question is therefore less about how long the game lasts and more about how long the attraction occupies venue capacity from one group to the next. A venue that wants to understand that cycle can break it into onboarding, launch, gameplay, reset, and recovery time. Those measurements quickly show where minutes begin to disappear. Where Do the Lost Minutes Go? Commercial VR attractions depend on more than the game itself. A session may involve standalone or PCVR headsets, local networking, tracking, commercial licensing, multiplayer synchronization, venue infrastructure, operator settings, and staff workflows. That means a delay can originate at several points in the session. A headset may require attention before launch. A multiplayer group may need to reconnect. Staff may need to correct a session configuration, restart an experience, confirm a tracking state, or recover a device before the next booking. On their own, these events may seem small. The operational effect becomes clearer when they are measured in the context of the group. Instead of simply recording that an issue occurred, record how much time it consumed, how many players it affected, whether the session finished, and whether staff had to intervene. That turns technical events into usable business information. Player-Minutes Lost Gives Downtime More Context One useful way to measure disruption in multiplayer VR is through player-minutes lost. The formula is: Player-minutes lost = disruption time × affected players Suppose one headset needs six minutes of attention. One player loses six minutes. An eight-player arena experiencing a six-minute group-wide delay loses 48 player-minutes. The clock shows the same six-minute interruption in both situations. The commercial effect is very different. This matters because attraction problems do not all have the same scope. Some affect one headset. Others affect part of a multiplayer group. A network, server, tracking, or shared-session issue may hold up the entire attraction. Looking at player-minutes lost gives operators a more realistic way to compare those incidents. Measure the Blast Radius, Not Just the Number of Incidents A simple incident count can be misleading. Ten small interventions affecting one headset are not necessarily more damaging than two interruptions that stop an entire free-roam session during peak hours. For that reason, it helps to classify problems according to their operational scope: one device, several players, or the whole attraction. This is where the idea of a blast radius becomes useful. It describes how far the consequences of an issue spread through the booked session. A single tracking prompt might delay one player briefly. A multiplayer state problem could hold up several people. A network or server-level problem may stop the entire experience until staff resolve it. From an operator’s perspective, those are different levels of risk even if each event appears as a single support case. What Recent Operator Support Conversations Show Support conversations offer an interesting view into attraction performance because they reveal where operators spend time while setting up, maintaining, and running commercial VR. For this article, we reviewed a sample of recent SynthesisVR operator support threads and grouped them by the type of operational question involved. These figures describe the reviewed support sample only. They are