The first three weeks of this series covered what free roam actually means as an operating model, why consumer hardware assumptions tend to break down in commercial environments, and how enterprise-grade headsets became the foundation most serious LBE operators build on. Week 4 is where the conversation shifts from technical decisions to financial ones, and specifically to the numbers that most operators don’t fully see until they’re already feeling the pressure.
Why the Cheapest Headset Rarely Ends Up Being the Cheapest Decision
It usually starts with a spreadsheet. Two headset options, a $300 price difference per unit, multiplied by ten headsets. A decision gets made based on $3,000. What that spreadsheet doesn’t capture is the next 24 months of actually running the business, and that gap between upfront cost and long-term cost is exactly where arenas succeed or quietly fail.
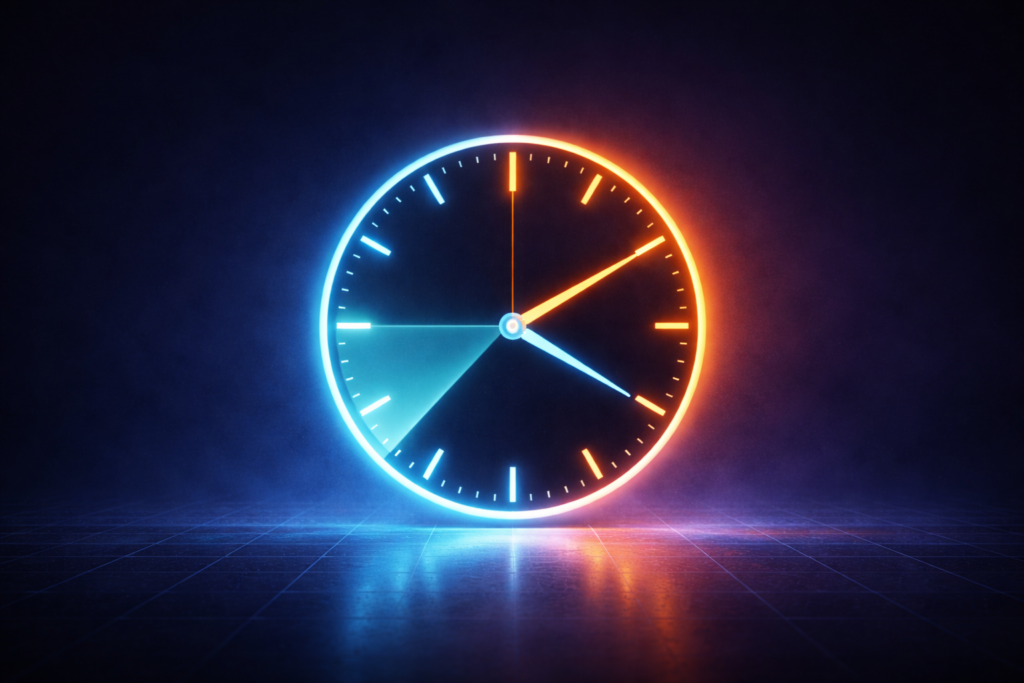
Two Financial Clocks Every Operator Is Running
To understand where the money really goes, two concepts are worth getting clear on: CapEx and OpEx.
Capital expenditure (CapEx) covers purchases that improve or provide future value for the company beyond the current year. These are typically investments in fixed assets: property, equipment, and infrastructure. In a VR arena, your headset fleet is CapEx. So is the router system, the play space build-out, and any physical infrastructure the experience requires.
Operating expenditure (OpEx) covers the day-to-day costs of running the business. Salaries, rent, utilities, marketing, supplies. These are the expenses that keep the lights on and the wheels turning. In an arena, OpEx includes staff wages, licensing fees, consumables, repairs, and every hour of manual intervention your team spends managing hardware that should be managing itself.
One of the real risks of a CapEx-heavy decision is that long-term commitments can limit your ability to adopt newer, better technologies. Investing large amounts of money and time in hardware assets may make you reluctant to change, even when the market demands it. In LBE VR, where hardware generations move fast and operational demands are high, that reluctance has a measurable cost.
Operators who struggle most tend to be the ones who optimized hard for CapEx and treated OpEx as something to figure out later.
The Cost That Never Appears on a Purchase Order
SynthesisVR’s operational data, gathered across hundreds of venues over nearly a decade, consistently surfaces the same pattern. The least profitable arenas rarely have the worst hardware. They have the highest daily labor burden on that hardware.
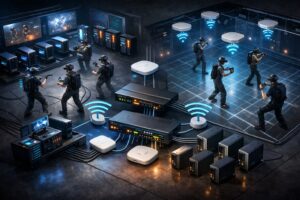
A useful way to frame it is what SynthesisVR refers to internally as the Maintenance Tax. Every headset fleet carries one. It is the cumulative daily labor your staff spends not serving guests, but keeping hardware operational, recalibrating, resetting, troubleshooting, managing OS interference, resyncing boundaries. It runs on a clock that never stops, and it almost never appears anywhere in the original business plan.
Consider a 10-headset fleet running 365 days a year with staff at $20 per hour. A consumer-grade headset can require up to 30 minutes of morning calibration per unit due to manual sync requirements, plus up to 15 additional minutes of ongoing drift and boundary troubleshooting throughout the day, plus further time managing consumer OS pop-ups, update prompts, and account interference. That adds up to roughly 60 minutes of maintenance labor per headset, per day.
An enterprise-grade headset with native persistent mapping and kiosk-mode OS control brings that same daily footprint down to approximately 20 minutes per unit.
Across a fleet. Across a year. That 40-minute daily difference per headset quietly becomes one of the largest line items in the business.
Based on SynthesisVR’s internal analysis of a 10-headset fleet over a 2-year operating period, the total cost of ownership gap between a consumer fleet and an enterprise alternative, when labor is properly accounted for, reaches $97,333 in payroll expenses alone. The fleet that cost less on day one ends up costing significantly more by month 24.
Why Reliability Beats Raw Specs in the Long Run
Spec sheets are easy to compare. Resolution, refresh rates, processing power, the numbers are clean. But in a live arena with multiple players moving simultaneously, what actually determines profitability is something no spec sheet measures: session consistency.
How reliably does a headset complete a session without staff intervention? How long does reset take between groups? How much throughput is lost each day to troubleshooting that shouldn’t have been necessary? These are the questions experienced multi-location operators lead with, and the answers shape profitability far more than processor benchmarks do.
SynthesisVR’s operational data reinforces this across venues of all sizes. Arenas that tracked session completion rates and reset times against their hardware choices found that operational stability, not headline specs, was the variable that separated profitable venues from ones that looked healthy on paper but felt squeezed in practice.
What Downtime Actually Costs
Downtime in an LBE environment is a revenue event, not just a frustration. Every session that doesn’t complete, every group that waits longer than expected, every headset pulling a staff member away from guests, each of those carries a real dollar figure attached to it.
If an average session generates $15 to $25 per player and a venue runs eight or more hours a day, a single headset losing 30 minutes of productive time daily represents thousands of dollars in missed annual revenue per unit. Scaled across a fleet, that operational drag compounds into a number that can quietly erase margin even at healthy booking volumes.
The operators who built SynthesisVR’s early playbook learned this pattern firsthand. Venues that opened strongly started showing financial pressure within months, not because of poor content choices or slow marketing, but because the daily labor overhead to maintain session quality was compressing margin in ways that never appeared on the original plan.
The Framework Ahead
The CapEx vs OpEx lens applies well beyond hardware. It shapes every system decision in a VR arena, content licensing, staff training, space design, and eventually how you scale from one location to more. The remaining weeks in this series build on this foundation, looking at where operational decisions silently drive cost up or hold throughput down.
Week 5 looks at space design, because dead zones and layout failures are almost always an OpEx problem that gets blamed on the build.
Disclaimer
The cost comparison and payroll estimates referenced above are based on SynthesisVR’s internal operational modeling of a 10-headset commercial VR deployment over a 24-month period. The model incorporates assumed daily device management time, average commercial payroll rates, and typical multi-unit location-based operating schedules. Actual results may vary depending on venue size, staffing structure, technical expertise, workflow efficiency, and operational procedures. This analysis is provided for informational and strategic planning purposes only and does not constitute financial guarantees or claims regarding the performance or suitability of any specific manufacturer’s products. All trademarks and information are the property of their respective owners.
SynthesisVR is trusted by 600+ locations worldwide. Built by operators, for operators. contact us to schedule a demo call at your convenience.
If you found this article helpful, we invite you to explore the rest of the series.
Week 1: Free Roaming with PICO
Week 2: The Consumer Trap: When Wrong Assumptions Costs Money!
Week 3: Why PICO Became the LBE Standard for Free Roam
Week 4: The Math of a Successful Free Roam Arena
Week 5: Designing a Free Roam Space That Actually Works
Week 6: Networking: The Invisible Backbone of Free Roam
Week 6.5: Networking for VR Venues: What You Need to Know Before You Build
Week 7: Mapping and Calibration: Ending the Drift Problem
Week 8: Launching Games Without Breaking the Flow