Running a profitable VR arcade requires more than knowing how many customers walked through the door.
Two venues might serve the same number of players in a day yet achieve very different results. One could have consistently booked stations, smooth session transitions, and content that encourages repeat visits. The other might struggle with idle headsets, interrupted games, and licensing costs that are difficult to reconcile.
Understanding these differences starts with tracking the right performance metrics.
For VR arcade operators and family entertainment centers (FECs), a handful of key performance indicators (KPIs) can reveal how efficiently attractions are running, which games deliver value, and where operational improvements can increase revenue.
Here are eight metrics worth monitoring and what each one can tell you about your business.
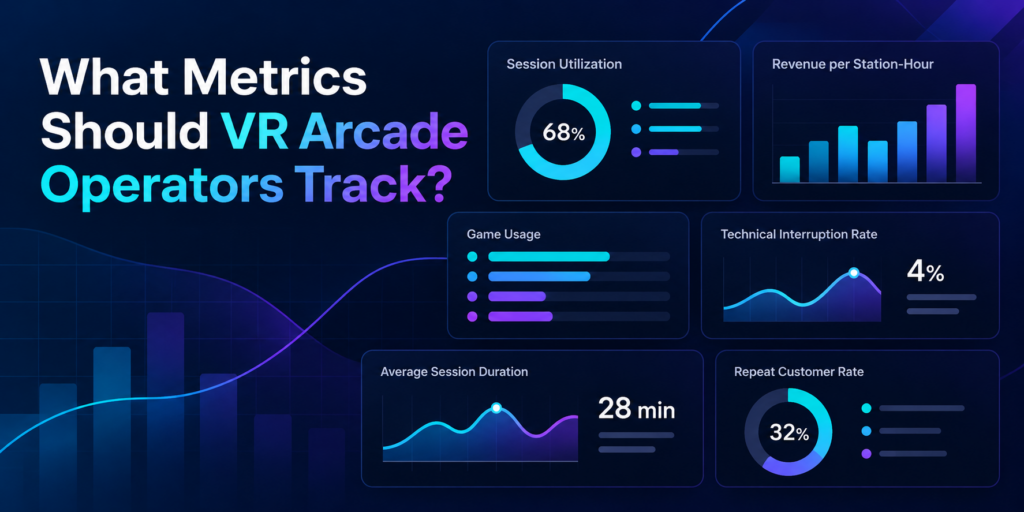
1. Session Utilization Rate: How Much of Your Available Capacity Is Being Used?
Session utilization measures how much of your available operating capacity customers actually use.
A VR arcade might have six stations available for eight hours a day, giving it 48 available station-hours. If customers occupy those stations for a combined 24 hours, the venue has a utilization rate of 50%.
Session Utilization Rate = Occupied Station-Hours ÷ Available Station-Hours × 100
For example:
- Available capacity: 6 stations × 8 hours = 48 station-hours
- Customer-occupied time: 24 station-hours
- Utilization rate: 50%
This metric helps operators understand whether their existing hardware and floor space are generating enough activity.
It also highlights patterns worth investigating. A venue might regularly reach full capacity on Saturday afternoons while leaving several stations unused on weekday evenings.
Tracking utilization by day, time slot, and attraction type can help operators make decisions about staffing, scheduling, group packages, and marketing.
What to do with this metric: Identify recurring low-utilization periods and test specific offers that encourage bookings during those hours.
2. Revenue per Available Station-Hour: What Is Your Capacity Actually Earning?
A busy station doesn’t always translate into strong revenue.
Some experiences generate more revenue per session but require longer playtime. Others have shorter sessions, allowing operators to serve more groups within the same period.
Revenue per available station-hour helps operators compare earning efficiency.
Revenue per Available Station-Hour = Station-Attributed Revenue ÷ Available Station-Hours
Consider a venue with four stations operating eight hours a day.
That represents 32 available station-hours.
If those stations generate $640 in customer revenue, the venue earns $20 per available station-hour.
The calculation becomes especially useful when comparing performance across different days or attraction types. For accurate comparisons, operators should consistently allocate revenue and capacity, particularly when selling multiplayer sessions, group packages, or combined attraction offers.
Revenue per available station-hour is not a profit measurement. Licensing expenses, staff wages, rent, equipment costs, and other operating expenses still matter.
What to do with this metric: Compare revenue efficiency across operating periods and use the findings to evaluate pricing, booking packages, and attraction scheduling.
3. Game Usage: Which Experiences Are Customers Actually Playing?
A large VR content library gives operators flexibility, but every game needs to serve a purpose.
Some titles attract first-time customers. Others encourage repeat sessions, support birthday parties, or work particularly well for groups.
Tracking game usage helps operators distinguish between player interest and actual activity.
Useful indicators include:
- Number of sessions launched per title
- Total playtime per game
- Average session duration
- Usage by day or time period
- Performance by attraction category
These indicators can reveal patterns that are easy to overlook.
For example, a highly requested multiplayer game might generate considerable initial interest but relatively few repeat sessions. Meanwhile, a familiar title with simple onboarding may remain popular with walk-in groups.
Operators should also consider audience fit. An escape experience designed for cooperative groups serves a different purpose from a competitive arena game built around repeat matches.
During SynthesisVR’s Arcades of the Roundtable discussions, operators highlighted the importance of understanding their game libraries, testing experiences, and responding to changing content preferences.
Game usage data provides another perspective on those decisions.
What to do with this metric: Review the content library periodically and compare usage with customer requests, technical reliability, and licensing costs before making changes.
4. Game Licensing Cost: How Much Does Each Experience Cost to Operate?
Commercial VR licensing is an important part of understanding game performance.
Depending on the title and licensing arrangement, operators may encounter prepaid credits, pay-per-minute (PPM) usage, or other commercial licensing models.
One detail deserves particular attention: booked session duration and billable game runtime may differ.
For example, a customer might book a 30-minute session, but a game process could remain active after the customer finishes playing.
Under licensing arrangements where usage continues until the executable terminates, this can result in additional charges.
SynthesisVR support inquiries have highlighted the importance of properly ending sessions and understanding how billable usage is recorded.
Operators should review:
- Billable runtime for individual games
- Licensing charges over a reporting period
- Prepaid credit consumption, where applicable
- Unexpected usage outside scheduled sessions
- Differences between session records and licensing charges
A useful calculated indicator is:
Licensing Cost per Paid Session = Total Applicable Licensing Charges ÷ Number of Paid Sessions Using That Content
This provides a starting point for evaluating content costs, although it doesn’t account for all operating expenses or differences between licensing models.
What to do with this metric: Reconcile licensing charges against recorded usage, investigate unusual activity, and ensure staff follow the correct session termination procedures.
5. Session Turnaround Time: How Quickly Can the Next Group Start?
A 30-minute VR booking often requires more than 30 minutes of operational attention.
Staff may need to help guests remove headsets, sanitize equipment, explain controls to the next group, configure the experience, and launch the next session.
Session turnaround time measures the gap between one group’s session ending and the next group’s session beginning.
Average Turnaround Time = Total Time Between Consecutive Sessions ÷ Number of Measured Transitions
Consider two venues offering the same 30-minute experience.
One consistently prepares the next group within five minutes. The other requires ten minutes.
Over a busy afternoon, that difference can reduce the number of bookings a station can accommodate.
However, turnaround time should be evaluated alongside guest comfort, equipment cleaning, and experience quality. The objective is a reliable and repeatable process.
Operators can improve consistency by preparing equipment in advance, using standardized onboarding instructions, and reducing unnecessary manual steps between sessions.
What to do with this metric: Measure actual transition times during busy periods and identify which preparation tasks create avoidable delays.
6. Technical Interruption Rate: How Often Do Sessions Experience Problems?
Technical issues affect more than the immediate player experience.
A failed game launch can delay the next booking. A network disconnection can interrupt a multiplayer group. A tracking problem can keep a headset unavailable until staff resolve it.
Support discussions involving multiplayer titles such as After The Fall and Arizona Sunshine have illustrated how some connection interruptions can require restarting a match when mid-session rejoining is unavailable.
For operators, tracking these incidents helps identify recurring problems.
Technical Interruption Rate = Sessions With Technical Interruptions ÷ Total Sessions × 100
For example, if five out of 100 sessions experience a technical interruption, the interruption rate is 5%.
Operators can record the causes separately:
- Game launch failures
- Network or streaming disconnections
- Headset tracking problems
- Multiplayer synchronization issues
- Licensing or configuration errors
The impact varies by issue. A brief launch delay may require a quick restart, while a failed multiplayer session could affect an entire group.
Another useful indicator is average recovery time, which measures how long it takes to return an affected station or attraction to service.
What to do with this metric: Identify recurring problems by game, device, or network setup, and prioritize fixes that affect the greatest number of bookings.
7. Repeat Customer Rate: Are Players Coming Back?
A first-time booking introduces someone to your venue. A repeat booking indicates that the experience gave them a reason to return.
Repeat customer rate helps operators understand whether their attraction mix and guest experience encourage continued interest.
Repeat Customer Rate = Returning Customers During a Period ÷ Unique Customers During That Period × 100
For example, if a venue serves 200 unique customers in a month and 50 have visited previously, its repeat customer rate for that month is 25%.
Accurate measurement requires a consistent way to recognize returning customers, such as a customer database or booking system that records visit history with appropriate consent.
Repeat visits are particularly relevant when evaluating content variety.
Someone who initially visits for a cooperative escape experience might return with friends for a competitive multiplayer game.
This gives operators a reason to think beyond individual game popularity and consider how different experiences work together.
During operator discussions, replayable multiplayer titles and longer experiences emerged as important considerations for attracting returning audiences.
What to do with this metric: Track returning visitors over time and test follow-up offers, content rotation, or group packages that give customers a specific reason to book again.
8. Revenue by Attraction Type: Which Experiences Contribute Most to Your Business?
Many location-based entertainment venues now offer several VR formats, including individual stations, room-scale experiences, and free-roam multiplayer attractions.
Each format has different requirements.
An individual station might serve one player at a time, while a free-roam arena can accommodate a group within a shared play area.
Comparing total revenue alone may therefore give operators an incomplete picture.
Useful indicators include:
- Total revenue by attraction type
- Number of paid sessions
- Average revenue per booking
- Revenue per available attraction-hour
- Licensing and other variable costs
- Average group size
For example, a multiplayer attraction might generate greater revenue per booking but require more floor space or longer preparation time.
A smaller station-based attraction may support more flexible walk-in bookings.
Operators need to consider both financial performance and the role each format plays in attracting different audiences.
What to do with this metric: Compare attraction categories using consistent revenue and capacity measures, while accounting for their different space, staffing, and licensing requirements.
How Often Should VR Arcade Operators Review Their Metrics?
Collecting data is useful only when operators turn it into decisions.
A simple review routine can make performance tracking manageable without adding unnecessary administrative work.
| Frequency | What to review |
| Daily | Failed sessions, unusual usage, station availability, and major technical interruptions |
| Weekly | Session utilization, revenue per available hour, game usage, and turnaround time |
| Monthly | Licensing costs, content performance, repeat visits, and revenue by attraction type |
| Quarterly | Pricing, attraction mix, capacity, and longer-term operational trends |
Not every venue needs a complex analytics system.
A small arcade can begin with a few reliable measurements and a basic spreadsheet. Larger locations may benefit from more detailed reporting across stations, games, booking periods, and attraction formats.
The important thing is to measure consistently and compare equivalent periods.
How VR Arcade Management Software Supports Performance Tracking
As operators add more games, headsets, and attraction types, managing the information behind each session becomes increasingly important.
A centralized VR arcade management system such as SynthesisVR helps operators organize sessions, control game launches, manage device activity, and access commercially licensed VR content.
These operational processes provide important context for understanding how a venue runs.
For a complete performance picture, operators may also need booking records, payment data, customer history, licensing statements, and manually recorded technical incidents. The exact reporting options depend on the tools and configurations in use.
Connecting the available information can help operators identify where capacity goes unused, where costs require attention, and which experiences deserve further investment.
Start With the Metrics That Lead to Better Decisions
A VR arcade can appear busy while still experiencing unused capacity, unexpected licensing charges, or inconsistent session delivery.
Tracking the right metrics helps operators understand what is happening behind the scenes.
Start with session utilization, revenue efficiency, and technical reliability. Add game performance, licensing costs, and customer retention as your reporting processes develop.
Each metric should answer a practical question and support a specific decision.
Whether you’re managing a few individual VR stations or a venue with multiple free-roam attractions, consistent performance tracking creates a clearer foundation for planning your next improvements.
Explore how SynthesisVR helps operators manage commercial VR content, sessions, and everyday venue operations.